2026考研英语二图表作文终极预测

- 1
- 5
- 2
摘要:针对英语二往年真题以及今年的热点,小编给大家带来了2026考研英语二图表作文预测!下面是详细内容。
注意:预测中提供的所有图表中的数据均为模拟数据。这些数据经过简化和处理,主要目的是用于写作训练和素材积累,以确保内容的清晰性和针对性。它们并非精确的官方统计数据,因此请勿将其引用或用于正式的研究或报告。
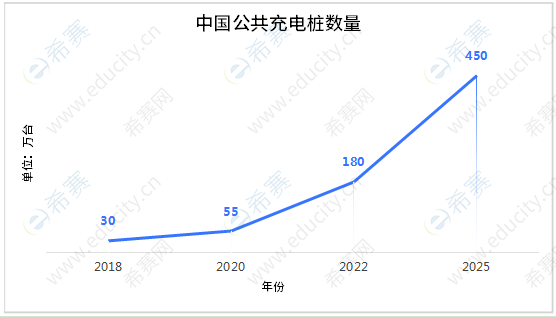
1、中国公共充电桩数量变化 (2018-2025)
Directions: Write an essay based on the chart below. In your essay, you should
1) describe and interpret the chart,
2) and give your comments.
Write your answer in about 150 words.
参考例文:
The line chart shows clearly how the number of public charging piles in China has grown a lot from 2018 to 2025. There were 300,000 in 2018, and the number is expected to reach 4.5 million by 2025. That means it will be 15 times larger in seven years.
This fast growth is mainly because the Chinese government strongly supports new energy vehicles and works hard to protect the environment. Building more charging stations solves a big problem for people who might buy electric cars—worrying that their car battery will run out. What’s more, this growth shows that the government and private companies have worked well together to build important facilities for a more sustainable future.
In short, the quick development of charging facilities not only helps China reach its goals of reducing carbon emissions, but also shows that China is leading the world in using electric vehicles. This progress will certainly speed up the move to greener transportation and help protect the environment a lot.
【译文】:
该折线图清晰地展现了中国公共充电桩数量从2018年到2025年的显著增长。2018年数量为30万台,预计到2025年将增至450万台。这意味着七年之间规模将扩大至原来的15倍。
这一快速增长主要得益于中国政府大力支持新能源汽车发展并积极推动环境保护。建设更多充电站有效解决了潜在电动车消费者的主要顾虑——担心车辆电池耗尽。更重要的是,这一增长表明政府与民营企业通力合作,为更可持续的未来共建重要基础设施。
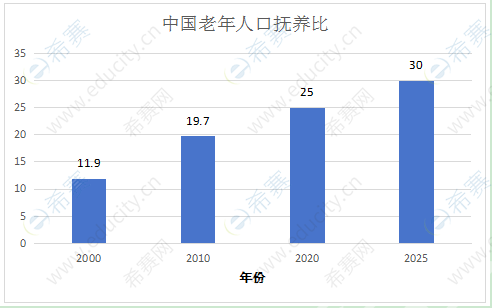
2、中国老年人口 (65岁及以上) 抚养比变化 (2000-2025)
注: 抚养比指每100名劳动年龄人口要负担的老年人口数。
Directions: Write an essay based on the chart below. In your essay, you should
1) describe and interpret the chart,
2) and give your comments.
Write your answer in about 150 words.
参考范文:
The chart vividly illustrates the significant change in the elderly dependency ratio in China from 2000 to 2020, with a projection for 2025. The ratio, which indicates the number of elderly people per 100 working-age individuals, stood at 11.9 in 2000. It then climbed steadily to 19.7 in 2010 and further to 25 in 2020. This upward trend is expected to continue, reaching 30 by 2025.
Two key factors contribute to this trend. On the one hand, it is a direct consequence of the declining birth rates and the previously implemented one-child policy, which have led to a smaller working-age population. On the other hand, significant advancements in healthcare and living standards have resulted in increased life expectancy, expanding the elderly population. This creates a double pressure on the social welfare and healthcare systems.
In conclusion, the soaring elderly dependency ratio presents a great challenge to sustainable economic and social development. It is imperative for the government to implement comprehensive strategies, including encouraging higher birth rates and improving the pension system, to address the implications of an aging society effectively.
译文:
该图表清晰地揭示了中国老年抚养比从2000年到2020年的显著变化,并对2025年作出预测。该比率指的是每100名劳动年龄人口需要抚养的老年人口数量,在2000年为11.9,随后稳步上升至2010年的19.7,并在2020年达到25。这一上升趋势预计将持续,到2025年将达到30。
两个关键因素共同推动了这一趋势。一方面,出生率下降及先前实施的独生子女政策直接导致了劳动年龄人口规模缩减。另一方面,医疗水平与生活标准的显著提升带来人均寿命延长,使得老年人口规模持续扩大。这对社会福利和医疗体系构成了双重压力。
总之,持续攀升的老年抚养比对经济社会可持续发展构成巨大挑战。政府亟需实施包括鼓励生育和完善养老体系在内的综合策略,以有效应对老龄化社会带来的各种影响。
希望以上信息对2026考研的同学有所帮助,文末“资料下载”可以免费下载完整版。

延伸阅读
- 2026年全国MBA院校信息汇总
- 2026年全国全日制MBA院校信息汇总
- 2026年全国非全日制MBA院校信息汇总
- 2026年浙江地区非全日制MBA学校信息汇总
- 什么是管理类联考?到底适合谁考?
- 读MBA到底有用吗?含金量和价值解析

工商管理MBA微信公众号

了解更多考试动态
工商管理MBA备考资料免费领取
去领取

3分钟匹配目标院校,覆盖院校1031所,多档次院校分析
- 1
- 5
- 2


 扫描二维码
扫描二维码
 扫描二维码
扫描二维码